
Franklin Covey (FC): Anticipated Future Returns
A probability-weighted framework for sizing risk, not telling stories.

One of the mistakes I’ve made repeatedly as an investor - even while thinking I was doing the “right” work - is this:
I spent enormous time understanding what a business is, why it’s misunderstood, and why it might be cheap, but far less time explicitly modeling what I expect to earn if I’m right… and what happens if I’m wrong.
That gap feels small in the moment. It isn’t.
Without a clear view of expected returns - across good outcomes, mediocre ones, and disappointing ones - capital allocation becomes guesswork dressed up as analysis. Position sizing becomes emotional. Conviction becomes narrative-driven. And patience becomes much harder to maintain when the stock moves up or down.
This post is less about Franklin Covey than it is about correcting that mistake - for myself first. It’s the kind of note I want to reread years from now, and eventually share with my kids when I start teaching them how value investing actually works in practice, not just in theory.
The Original Thesis (Still True)
The market thinks Franklin Covey is a slow-growth training company.
It isn’t.
Franklin Covey is a subscription-based, global human-performance platform whose economics are obscured by accounting rules that delay revenue recognition by 12–24 months.
Customers buy the All Access Pass (AAP) - a recurring subscription that includes:
Leadership development
Cultural alignment programs
Trust-building frameworks
Execution systems
Coaching, consulting, and digital tools
AI-enabled reinforcement and practice
Conceptually, it’s closer to:
LinkedIn Learning + behavioral consulting + SaaS-like subscriptions + coaching-as-a-service
But with something harder to replicate: 40 years of codified IP (7 Habits, Speed of Trust, 4DX) and deep institutional embedding across Fortune 500 enterprises and more than 8,000 schools.
This isn’t content you read.
It’s content organizations run on.
The Transformation That Created the Mispricing
Over the last decade, Franklin Covey deliberately rebuilt itself around:
Subscription revenue
Multi-year contracts
Recurring services
Digital delivery
Capital-light economics
Today:
Subscription revenue represents the majority of total revenue
Multi-year contracts represent 61% of contracted value
Subscription gross margins approach 100%
Services gross margins run 60-65%
Balance sheet is unlevered with net cash
Business is capital-light and cash generative
In FY25, management made a difficult but necessary decision: they restructured the sales organization.
But why?
In retrospect, the FY22–FY23 surge in expansion revenue appears to have been less durable than it initially looked.
As those expanded contracts entered renewal cycles in FY24–FY25, net expansion slowed materially, pressuring deferred revenue and operating cash flow.
The data tells a clear story (per annual 10-K filings):
Unbilled Differed Revenue (UBDR) peaked at $87M in FY23
Declined to $73M by FY25
This suggests FY22-23 multi-year deals either:
Renewed shorter (2yr → 1yr)
Or didn’t renew at similar contract values
Against that backdrop, management’s decision to restructure the sales organization - moving toward specialization, clearer role separation, and longer-duration contracts - looks less like a growth initiative and more like a necessary correction to improve renewal quality and cash flow durability.
They moved from a generalist model to:
Hunters and farmers
Vertical specialization
Better pipeline management
Higher ACVs
Longer-duration contracts
That transition - compounded by macro uncertainty early in FY25 - did suppress reported results and near-term cash flow.
But critically, this was a self-inflicted, transitional economic reset, not a deterioration in the underlying value of the franchise.
The market priced it as permanent impairment.
That mismatch is the source of the mispricing.
The Accounting Lag (The Real Source of Confusion)
Here’s the key mechanic the market still struggles with:
Cash and contracts grow first.
Reported revenue follows 12–24 months later.
A majority of contracted dollars (61%) are tied to multi-year contracts, which flow like this:
Year 1 → billed upfront → Deferred Revenue
Years 2–3 → contracted but unbilled → Unbilled Deferred Revenue (UBDR)
GAAP revenue → recognized ratably over the contract term as access and services are delivered
That means:
UBDR is the true leading indicator
Deferred revenue is lagging confirmation
GAAP revenue is the last thing to move
UBDR is not “missing revenue” - it’s future contractual revenue awaiting billing, and its durability depends on renewal quality.
This is why FY25 looked weak even as underlying economics stabilized.
It’s also why FY26 will likely look “fine but uninspiring” - while FY27 is already being shaped economically today.
Why This Is NOT Speculation
Speculation bets on unknowns.
This situation does not.
Key indicators through FY25 and into FY26:
New logo activity remained healthy despite the sales transition
Invoiced amounts improved despite a disruptive sales reorganization
Services and coaching penetration increased
Client retention remained stable, with pressure concentrated in expansion rather than logos
Deferred revenue continued to grow
UBDR stabilized after the renewal cycle
Leading indicators in Q1 FY26 improved meaningfully.
NA invoiced growth: +7% (+13% ex-government)
New logo subscriptions: +25% YoY
Services bookings: +29% YoY
Deferred revenue: +5% YoY to $100.2M
Multi-year contract mix: 61% of contracted value (stable)
If Franklin Covey had lost relevance or market share, these indicators would not be improving.
This was not a loss of relevance or demand - it was an execution and timing problem.
That distinction matters.
What became clear to me as I worked through Franklin Covey wasn’t just something about the business itself - it was something about my own process.
I was comfortable saying the reported weakness came from execution and timing rather than a broken model. I was comfortable saying the economics were real but delayed. What I wasn’t yet doing was forcing myself to fully translate that view into explicit outcomes and probabilities.
That’s where I had to slow down.
Up until now, I’ve typically framed investments using three scenarios: bull, base, and bear. It’s a useful shorthand, and it’s how I’ve approached most opportunities in the past. But as I dug deeper into Franklin Covey, I realized that framework can blur an important distinction.
In practice, what we casually call a “bear case” often combines two very different realities:
situations where the business works, but returns disappoint
and situations where capital is impaired even though nothing collapses
Those outcomes may sit next to each other in a spreadsheet, but they demand very different position sizing, patience, and risk management.
So rather than abandoning the old framework, I refined it. For the first time, I explicitly modeled four outcomes instead of three, separating out a true left tail - not because it’s likely, but because pretending it doesn’t exist makes sizing decisions harder than they need to be.
This is the framework I’ll use going forward.
The Four Scenarios (2-3 Year General)
Starting point:
Stock price: $19
Shares outstanding (pre-buybacks): ~11.9M
Net cash: ~$20M
$20M buyback authorization (~10% of shares)
1. Left Tail: Capital Impairment (≈10%)
Nothing blows up.
There’s no fraud.
No leverage.
No bankruptcy.
But execution remains weak, working capital never normalizes, and renewals shorten.
Assumptions (FY27):
EBITDA stagnates: ~$28–29M
FCF conversion: ~55–60%
FCF: ~$15–18M
Buybacks: only the $20M authorization
Shares: ~10.8M
Market multiple: ~9× FCF
Outcome:
Equity value ≈ $150–165M
Stock price: ~$15–17
This is the Type-1 error I am trying to avoid.
Note: This is not bankruptcy or collapse. This is chronic weak execution with working capital issues that persist. No fraud, no leverage, no secular obsolescence - just a business that doesn't work well enough.
2. Bear: Stall / No Re-Rate (≈30%)
The business works - but not well enough.
Assumptions (FY27):
EBITDA grows modestly: ~$32–33M
FCF conversion: ~68%
FCF: ~$22M
Buybacks slow after authorization
Shares: ~10.5M
Market multiple: ~10× FCF
Outcome:
Equity value ≈ $230–240M
Stock price: ~$22–23
You don’t lose much.
You don’t get paid.
This is the most dangerous outcome psychologically.
3. Base Case: Slow Normalization (≈40%)
Execution improves gradually.
Assumptions (FY27):
EBITDA: ~$36–38M
FCF conversion: ~70–72%
FCF: ~$25–27M
Buybacks continue modestly
Shares: ~9.9–10.0M
Market multiple: ~13× FCF
Outcome:
Equity value ≈ $350–380M
Stock price: ~$30–36
This is a solid, respectable outcome.
4. Bull Case: Bow Wave Releases (≈20%)
Everything lines up.
Assumptions (FY27):
EBITDA: ~$45–50M
FCF conversion: ~72–75%
FCF: ~$30–35M
Aggressive buybacks funded by cash
Shares: ~9.4–9.6M
Market multiple: ~15× FCF
Outcome:
Equity value ≈ $450–520M
Stock price: ~$45–55
This is the asymmetry - but it must be earned.
Probability-Weighted Expected Returns
Expected return from $19: ~+78%
Expected IRR (~3 years): ~20–22%
That return profile is attractive, but it comes with real uncertainty - including a meaningful probability of underwhelming outcomes and a smaller, but non-trivial, risk of capital impairment.
Translating Expected Returns into Intrinsic Value
Rather than treating probability-weighted outcomes as something to discount again, I found it more useful to ask a simpler question:
What does the market appear to be assuming today?
At roughly $19 per share, Franklin Covey is being valued somewhere between my stall and base scenarios. In effect, the market seems to be pricing in a meaningful chance that execution fails to improve materially, that free cash flow conversion remains inconsistent, and that the business never earns a durable re-rating.
That skepticism is understandable. It reflects recent execution scars and the reality that accounting recognition still lags the underlying economics.
What My Work Suggests Instead
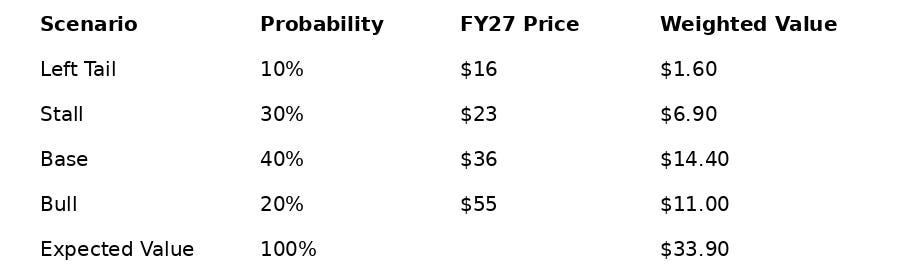
After explicitly modeling four outcomes - including a true left tail - my own probability-weighted view looks different:
roughly 60% probability of base-or-better outcomes (>$30 per share),
about 30% probability of a stall outcome (~$23 per share), and
approximately 10% probability of capital impairment (~$16 per share).
Weighting those outcomes produces an expected value of approximately $33–34 per share in 2–3 years, compared with a current price of ~$19.
That gap does NOT represent certainty. It represents potential alpha - if my probabilities are closer to reality than the market’s.
Viewed through that lens, buying Franklin Covey at ~$19 implies an expected annual return of roughly 20–22%, over three years, driven not by heroic assumptions, but by modest execution improvement, normalization of cash-flow conversion, and rational capital allocation through buybacks.
What This Means for Positioning
There remains a real probability of underwhelming outcomes, and a smaller but meaningful probability of capital impairment without collapse. Because of that, this is NOT a situation that justifies aggressive sizing today.
Franklin Covey earns a starter position, not blind conviction.
Capital is best reserved and scaled only as the data - particularly free cash flow conversion - proves the thesis rather than the narrative.
This is how patience becomes discipline instead of paralysis.
The Lesson I’m Taking Forward
The most important takeaway here isn’t about Franklin Covey.
It’s this:
I don’t think I can allocate capital well without explicitly modeling expected returns and their probabilities.
A great business can still be a poor investment.
A misunderstood company can still disappoint.
And conviction without probabilistic thinking is just storytelling.
This post is me correcting that - in public - so I don’t forget it later.
Franklin Covey remains on the front edge of my radar.
The economics are real.
The accounting lag is undeniable.
The upside exists.
But execution stories must be validated, not assumed.
So for now:
I watch closely
I verify relentlessly
I let the data prove it
If I ultimately add more, it won’t be because the narrative improved.
It will be because the expected returns earned the right to size.
Disclaimer
This memo reflects my personal investment framework and opinions. It is not investment advice. I may be wrong, and circumstances can change. I reserve the right to change my mind as new facts emerge.
 | A guest post by
|