
ZoomInfo (GTM): The Data Asset the Market Forgot How to Value
Why we believe ZoomInfo is being valued like a melting ice cube despite generating $400M+ of annual free cash flow.

I have spent the last several weeks doing some of the deepest analytical work of my investing career on ZoomInfo Technologies. I went back and read every earnings transcript since the 2020 IPO. I built, by hand, a free cash flow model from scratch multiple times, corrected my own errors along the way, stress-tested the thesis against every bear case I could construct, and did the competitive analysis that earlier versions of this memo were missing. Seven rounds of external critique have sharpened the argument considerably and lowered my stated conviction in places where the evidence does not support high conviction.
I am optimizing for Type 1 error avoidance - protecting against permanent capital loss - rather than Type 2 error avoidance. I would rather miss some upside than risk permanent impairment of capital on an unproven moat thesis. The position size and entry discipline reflect that priority throughout.
The punchline: at current prices you are likely entering at approximately 3.9x the normalized earning power of this business, managed by a founder whose compensation is worthless unless the stock goes above $40, who is authorized to retire roughly the entire market cap through buybacks, on a data asset that appears to be among the most comprehensive commercial B2B datasets currently available. Whether that moat is durable enough to compound value beyond the 3-year capital recovery horizon is a question this memo cannot fully answer from public data alone. The investment is sized accordingly.
This Appears to Be a Data Utility, Not a SaaS Business
Most investors analyze ZoomInfo as a SaaS business - focusing on seat counts, churn rates, and ARR growth. That framing likely explains why the stock is mispriced.
ZoomInfo appears to be a data infrastructure business that has always been a data infrastructure business. The SaaS interface was the wrapper built around the product to monetize it in an era when SaaS multiples were at 20–40x revenue. Analyzing ZoomInfo as a SaaS business is likely the analytical equivalent of analyzing a railroad by counting train tickets sold rather than examining the value of the right-of-way.
The actual product is a continuously updated, entity-resolved database of 500+ million business professionals and 100+ million companies, enriched with direct dial phone numbers, real-time organizational chart changes, intent signals derived from web activity, technographic data, funding details, and buying alerts. The most valuable portions of this data likely do not exist on the public web. They appear to come from two proprietary contributory networks where customers and community members actively share business contact information in exchange for enriched data back.
Understanding ZoomInfo requires understanding four distinct layers of the data asset.
Layer 1: The Contributory Network
The most defensible data appears to come from the contributory network. When a sales rep at Company A verifies a direct dial, confirms a job title change, or updates a contact record, that information feeds back into the network and improves the data for every other subscriber. This network is reciprocal - participants give and receive, creating a genuine incentive to contribute accurately. It appears to produce data that does not exist in the public domain - specifically direct dial phone numbers for business professionals, which are not published publicly and cannot be inferred from public sources. It likely benefits from density in a self-reinforcing way - a larger network likely produces better data, which attracts more subscribers, which produces a larger network. ZoomInfo has been running this network for over 20 years across 35,000+ customers.
Layer 2: Entity Resolution at Scale
This is the least understood and arguably most important component of the competitive position. Entity resolution means taking billions of raw data points from thousands of sources and resolving them into a single authoritative record for each company and professional. The same person appears differently across dozens of sources. Their employer has been acquired. The legal entity name has changed. Their phone number changed. Their reporting structure changed. All of this needs to be resolved into one clean, current, accurate record that a sales agent or AI workflow can act on without verification.
ZoomInfo processes 1.05 trillion intent signals monthly and enriches 5.5 billion data attributes. The entity resolution engine has been trained on 20+ years of data corrections, human-in-the-loop quality assurance, and feedback from 35,000+ customers flagging inaccuracies. This training advantage may be the deepest and most durable component of the competitive position.
Layer 3: Privacy Governance Infrastructure
Almost never discussed in investment analysis and genuinely important. ZoomInfo operates under CCPA, GDPR, PIPEDA, and dozens of other privacy regimes simultaneously. Building commercially usable B2B contact data requires privacy compliance that can satisfy multiple regulatory regimes simultaneously. Getting it wrong is not just expensive - it is potentially existential. This infrastructure appears to be why ZoomInfo’s data is commercially usable in enterprise contexts where some competitors are not.
Layer 4: Integration Depth
ZoomInfo is embedded in the workflows of 35,000+ customers through integrations with Salesforce, HubSpot, Microsoft Dynamics, and dozens of other platforms. These integrations appear to create operational switching costs - ripping out ZoomInfo requires reconfiguring not just ZoomInfo but the entire downstream CRM and marketing automation infrastructure. This appears to be what produces above-100% NRR in the upmarket enterprise segment.
The AI Era Framing
The market may be materially overestimating the probability that AI reduces the value of ZoomInfo’s data assets.
Foundation models are remarkable at reasoning, writing, summarizing, and automating. They do not inherently know which companies are real targets, which contacts are current, which buying signals are fresh, or which account hierarchies matter. ZoomInfo’s direct dial numbers are not in any training corpus. Real-time org chart changes are not publicly available. Intent signals derived from billions of monthly web activity signals cannot be inferred from static training data. AI-driven go-to-market likely becomes useful only when the model is grounded in accurate, permissioned, current, entity-resolved business context. That appears to be what ZoomInfo sells.
The consumption story supports this directionally. Henry Schuck described on the Q1 2026 call a pattern emerging among AI-native customers: companies reducing seat counts but consuming significantly more ZoomInfo data through APIs, MCPs, and bulk credit purchases as they build internal revenue workflows. MCP connections are growing organically without dedicated sales or marketing resources. These are early data points consistent with the thesis. They are not yet proof.
The most concrete confirmation available: Salesforce released its AI prospecting agent with ZoomInfo as the first and primary external data provider. HubSpot shipped its prospecting agent with a native ZoomInfo integration. ZoomInfo launched connectors for ChatGPT, Claude, Microsoft Copilot, and Perplexity. When the two largest CRM platforms choose ZoomInfo to power their AI agents, the revealed preference of the market is informative. It is evidence, not proof, of durable data quality.
The Competitive Analysis: What Stops the Moat From Narrowing?
The most important competitive risk is not replacement. It is compression. The nightmare scenario is not ZoomInfo going away. It is ZoomInfo surviving but losing pricing power as competitors achieve 75–80% data fidelity at meaningfully lower prices.
One important caveat: the competitive assessments below are based entirely on public filings, earnings transcripts, and industry analysis. They have not been validated through primary research. That primary research is the explicit precondition for sizing this position above 5% of our portfolio.
Salesforce: Today Appears More Likely to Remain a Partner Than Become a Competitor
Several structural constraints appear to make direct competition implausible in the near term. The conflict of interest problem: Salesforce’s business model appears to depend on being a neutral platform. If Salesforce became a data competitor they would create a direct conflict with every data provider on their AppExchange. Their choice of ZoomInfo as primary external data provider for their AI prospecting agent is consistent with a company that has concluded build-vs-buy favors buy - though it is evidence of current preference, not permanent commitment. The privacy liability problem: mining Salesforce CRM data for a contributory network would expose them to catastrophic liability. The economics problem: the ROI on building a competing B2B data network appears poor against Salesforce’s existing opportunities.
Today Salesforce appears more likely to remain a partner than become a competitor. That assessment warrants ongoing monitoring.
Microsoft and LinkedIn: Credible Long-Term Threat, Not a 3-Year Risk
Microsoft owns LinkedIn with 1 billion members. Several structural constraints appear to limit this threat within the 3-year investment horizon. The direct dial problem: LinkedIn does not appear to have direct dial phone numbers in any volume comparable to ZoomInfo and the platform architecture does not naturally generate them. The data freshness problem: LinkedIn profiles are self-reported and updated infrequently. The entity resolution gap: LinkedIn shows you a list of people at a company; ZoomInfo appears to provide organizational hierarchy requiring continuous entity resolution across billions of data points. The privacy litigation exposure: significant expansion of how Microsoft monetizes LinkedIn professional data would likely face regulatory challenge.
Within the 3-year investment horizon these constraints appear durable. Over a 7–10 year horizon, Microsoft’s resources and LinkedIn’s existing data create a genuine risk that the competitive gap narrows.
On the Acquisition Scenario: Upside Optionality Only
Strategic buyers are aware that ZoomInfo exists. The strategic rationale is clear. However, acquiring ZoomInfo is more complex than the headline market cap implies. The $2.73 billion TRA liability - more than twice the equity market cap - must be factored into any acquisition analysis alongside $1.33 billion of gross debt and the pending securities class action. The effective total consideration for a buyer is substantially higher than the equity price suggests. Strategic buyers do not rescue distressed equity holders at premiums. The acquisition scenario is real upside optionality. It is not a floor on downside.
OpenAI and LLMs: Increases Demand at the Data Layer
LLMs appear unable to generate accurate contact information for specific living professionals because that information is not in any public training corpus. This is a structural constraint, not a capability gap that closes with scale. The legitimate risk is to ZoomInfo’s application layer. ZoomInfo’s strategic response of deprioritizing application development and investing in data infrastructure, APIs, and MCP integrations is the correct answer to this threat.
The Apollo Question: The Largest Unresolved Variable in the Thesis
Apollo.io is not just a competitor. Apollo is the variable that determines whether ZoomInfo’s moat is real or whether it is simply better execution.
That distinction matters enormously. A real moat means ZoomInfo’s data advantage is structural - rooted in the density and quality of its contributory network, its 20-year entity resolution training advantage, and the enterprise-quality contributors that produce data no competitor can replicate at comparable cost. Better execution means Apollo is simply behind on the same journey and is closing the gap with sufficient capital and time.
If the moat is real, ZoomInfo survives and compounds. If the moat is simply better execution, Apollo eventually catches up - not necessarily by replacing ZoomInfo but by reaching sufficient fidelity at a lower price point that ZoomInfo loses pricing power in its most important segment.
The case that the moat is real:
Apollo’s contributory network is built primarily on free users like early-stage startups, individual salespeople, and SMBs - sharing contact data in exchange for free credits. ZoomInfo’s contributors appear to include thousands of enterprise sales teams at Fortune 500 companies, each verifying contact data for the executives they actually call. The quality of the contributor base likely determines the quality of the resulting data in ways that matter most for enterprise use cases, specifically the accuracy of direct dials for senior decision makers at large companies.
This contributor quality gap, if real, is self-reinforcing. Enterprise contributors produce better data. Better data attracts more enterprise subscribers. More enterprise subscribers produce more enterprise contributors. After 20 years of this cycle, the density advantage in the enterprise segment may be genuinely difficult for Apollo to close - not because Apollo lacks capital or ambition, but because the only way to build enterprise-quality contributor density is to first attract enterprise customers, which requires already having enterprise-quality data. The circularity is the moat.
The publicly available evidence is consistent with this hypothesis. The $100K+ ACV customer cohort has continued growing despite three years of aggressive Apollo competition. Upmarket NRR has been above 100% for multiple consecutive quarters. Enterprise customers are not churning to Apollo at any visible scale.
The case that the moat is simply better execution:
Apollo has 1.4 million users and is growing rapidly. Its contributory network, while currently skewed toward smaller contributors, is expanding. As Apollo’s enterprise customer base grows, which it is, the quality of its contributor base improves. The gap may be closing faster than ZoomInfo’s public metrics reveal. Enterprise procurement decisions have long sales cycles and annual contract terms, meaning Apollo wins today may not show up in ZoomInfo’s churn data for 12–18 months.
More importantly, Apollo does not need to achieve 100% of ZoomInfo’s data quality. It needs to reach 75–80% at a meaningfully lower price point. If an enterprise buyer concludes that Apollo’s direct dial accuracy is sufficient for their workflow at 40% of ZoomInfo’s cost, ZoomInfo’s pricing power erodes regardless of whether their data is technically superior. Commoditization does not require perfect replication. It requires good enough.
The honest answer:
This question cannot be resolved from public data. The evidence available - stable enterprise customer metrics, above-100% upmarket NRR, growing $100K+ cohort despite Apollo competition - is consistent with a real moat. It does not prove one. Direct dial accuracy comparisons, win rates in competitive evaluations, and customer migration statistics are not publicly available. An investment committee reviewing this memo would rightly demand that evidence.
The Apollo question is why the position must be capped at 5% before primary research. It is why the thesis requires at least base case confirmation before scaling. It is why the bear case, where the moat is real but the market never trusts it, carries 35% probability. And it is why the single most important primary research question for this investment is not about Microsoft, not about the TRA, not about the litigation, and not about refinancing. It is this: talk to enterprise buyers who have evaluated both ZoomInfo and Apollo in the last 12 months, and ask them what they found.
That conversation - more than any public filing or earnings transcript - will tell you whether the moat is structural or executional. Until it happens, we will size accordingly.
The Litigation Overhang
Three distinct legal proceedings warrant acknowledgment.
The most significant is a securities class action filed September 2024 covering purchasers of ZoomInfo common stock between November 2020 and August 2024 - the entire post-IPO period through the stock’s sustained decline. The suit alleges false and misleading statements about the company’s business and the effects of COVID-19 on performance. The motion to dismiss was denied, meaning the court found the case has sufficient merit to proceed. Two related derivative actions are consolidated and stayed pending the securities case. A third derivative action was filed in Delaware Chancery Court in March 2026. Separately, three privacy-related class actions are pending regarding ZoomInfo’s data collection practices.
The financial impact is likely manageable. ZoomInfo carries D&O insurance, and securities class action settlements typically fall within policy limits for companies of this size. The more important practical consequence is institutional. Many fiduciary investors are restricted from owning companies with pending securities class actions where the motion to dismiss has been denied. This creates a persistent multiple suppression that is entirely independent of the underlying business quality - a contributing factor to the permanent multiple imprisonment risk in the bear case.
The resolution timeline is approximately two years from today, consistent with typical discovery and settlement timelines post-motion to dismiss. When the litigation resolves, which is the most likely outcome given D&O coverage and typical settlement economics, institutional ownership restrictions lift and the settlement announcement becomes a potential re-rating catalyst. In the base and bull scenarios, litigation resolution within the investment horizon is explicitly modeled as a positive catalyst. In the disaster scenario, the possibility of an above-limits settlement compounding a balance sheet stress event is explicitly modeled as an additional risk.
Watch for: discovery developments, trial date setting, and settlement announcements. A within-limits settlement is a positive catalyst. An above-limits settlement requiring meaningful balance sheet cash warrants position reassessment.
The Capital Allocation History
Chorus.ai - $575 million in cash, 2021.
ZoomInfo acquired Chorus, a conversation intelligence platform, for $575 million at the peak of the SaaS bubble. At today’s stock price of $3.85, that $575 million would have retired approximately 149 million shares - roughly half the current share count. The opportunity cost is staggering.
Buybacks at the wrong prices.
ZoomInfo repurchased significant amounts of stock in 2021 and 2022 at prices ranging from $20 to $65 per share - 30–60x earnings. The correct behavior was to issue equity at those prices and build the balance sheet. Management retired shares at prices that have since declined 90–95%.
The resulting debt.
$100 million revolver due February 2028, $650 million Senior Notes at 3.875% due February 2029, $581 million term loan due February 2030. At 2.4x EBITDA the leverage is manageable. But it constrains strategic flexibility and introduces refinancing risk.
The same management team is now sitting on $1.14 billion of buyback authorization with the stock at $3.85. The math has inverted. The same behavior that was destructive at $40 is value-creating at $3.85. Management did not get smarter. The price got so low that the same action produces a completely different outcome.
What Happened to the Business
The COVID pull-forward. ZoomInfo went public in June 2020 at the perfect moment. Revenue growth accelerated dramatically. Management responded by hiring aggressively and guiding to growth rates that assumed the COVID environment was the new normal. When in-person selling resumed and IT budgets tightened in 2022–2023, growth collapsed from 40%+ to low single digits.
The SMB mistake. ZoomInfo aggressively expanded into small and medium businesses generating high churn, high bad debt, and low lifetime value. By 2024, overall net revenue retention had fallen to 87%.
The strategic correction. Management is executing a deliberate transition: exit SMB, concentrate on enterprise customers spending $100,000 or more annually, build the Operations segment. Net revenue retention has improved from 87% to 90%. The $100K+ ACV cohort has grown from 1,820 to over 1,900. Operations crossed $200 million of ARR growing above 20% annually.
The AI confusion. In March and April 2026, enterprise software customers paused purchasing decisions because of genuine confusion about what AI can and cannot do in a go-to-market context. This appears specific to the software vertical - management noted strong performance in manufacturing, financial services, insurance, real estate, and telecom.
The restructuring. In May 2026, ZoomInfo announced a 20% workforce reduction, approximately 600 employees, closing Israeli R&D operations and eliminating down-market sales resources. This produces $60 million of annualized run-rate cost savings beginning in 2027 and $45–60 million of one-time cash restructuring charges in Q2 and Q3 2026. Revenue will be negative year-over-year for several more quarters (per management guideance). Positive growth does not return until the second half of 2027 at the earliest. When growth returns, management projects 40% adjusted operating income margins.
The New Business Model
Starting Q3 2026, ZoomInfo will offer a hybrid pricing structure: a low annual platform fee plus pre-purchased data consumption credits usable across any interface, ZoomInfo’s own applications, Salesforce, HubSpot, Claude, ChatGPT, or internally built revenue workflows.
This matters for three reasons. It removes the seat compression problem - if AI agents consume data at scale, consumption-based revenue grows with AI adoption rather than declining with seat count reduction. It improves net revenue retention dynamics over time - consumption-based expansion happens automatically as customers use more data rather than requiring a negotiation. And it positions the business correctly for what it appears to be, a data infrastructure layer rather than a seat-based application.
Whether the consumption model successfully replaces seat-based revenue losses is the central execution question for the entire thesis.
The Numbers That Matter
Most analyses of ZoomInfo use non-GAAP metrics that exclude stock-based compensation. At approximately $100 million of annual SBC, that exclusion matters significantly. Real owner earnings must include SBC as a real economic cost.
2026 real owner earnings as reported this year:
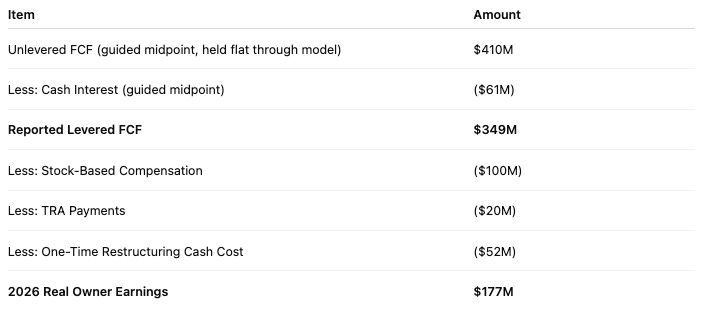
Entry multiple on 2026 actual: $1.13B / $177M = 6.4x
Normalized real owner earnings:
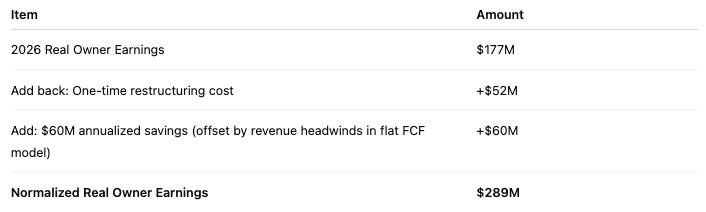
Entry multiple on normalized basis: $1.13B / $289M = 3.9x
I model unlevered FCF flat at $410 million across 2026, 2027, and 2028. This is deliberately conservative - the $60 million restructuring savings are assumed to be fully offset by revenue headwinds, rising AI consumption costs, and capex normalization. I do not build in improvement that has not been proven.
The Buyback Engine - With Honest Assumptions
ZoomInfo has $1.14 billion of remaining buyback authorization. Three factors constrain the buyback math meaningfully.
TRA payments compete directly with buyback capacity. From 2027 onward I model $55 million annually - the high end of the reasonable range given normalizing taxable income. The company paid $94 million in TRA payments in 2024 and only $23.6 million in 2025 when restructuring charges suppressed taxable income. As earnings normalize TRA payments increase, competing directly with every dollar available for buybacks.
Board conservatism ahead of debt maturities. I model 75% of available FCF deployed into buybacks rather than 100%, preserving a buffer against refinancing uncertainty.
The stock is unlikely to stay suppressed. With Henry buying aggressively on the open market and the board’s buyback program running, the stock likely re-rates faster than a model assuming depressed average prices would imply. I model average buyback prices of $5.50 in 2026, $9.00 in 2027, and $11.00 in 2028. Higher buyback prices mean fewer shares retired per dollar. That is the honest cost of the re-rating assumption and it means the per-share math is less mechanically powerful than prior models assumed.
Buyback framework:
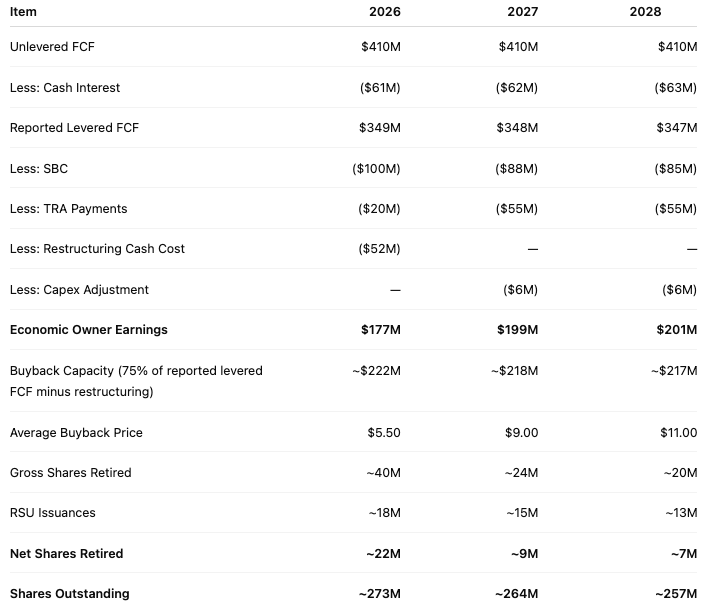
By end of 2028, share count has been reduced by approximately 13% from today’s level. The thesis therefore depends both on business quality confirmation and share count arithmetic.
Henry Schuck’s compensation reinforces the buyback probability. His performance option covers 9.678 million shares at an exercise price of $13.54 - currently 252% out of the money. The first vesting tranche requires both a $40 stock price AND $2.50 of FCF per share simultaneously. Aggressive buybacks at current prices are one of the most direct paths to achieving that condition. He makes nothing unless shareholders do extremely well first.
The FCF Stress Test - What Breaks the Thesis
The declining FCF scenario: $410M to $350M to $300M…
This implies a $110 million decline in unlevered FCF over two years - a 27% decline from the 2026 level. This happens when revenue declines faster than costs can be cut and the restructuring savings are more than offset by revenue deterioration.
At $285 million of stabilized unlevered FCF in 2029 with cash interest rising to approximately $72 million on a stress refinancing, TRA payments falling to approximately $18 million as taxable income remains suppressed, and SBC declining to approximately $80 million: economic owner earnings are approximately $115 million on approximately 242 million shares - $0.48 per share.
At a 3x exit multiple: $1.44 - a 63% total loss. At a 4x exit multiple: $1.92 - a 50% total loss.
The declining FCF scenario produces permanent capital loss regardless of entry price. A large litigation settlement above D&O policy limits in this scenario compounds the damage further. The margin of safety in this investment comes not from the 3.9x entry multiple alone but from the FCF being genuinely durable.
The single most important monitoring number: Full year unlevered FCF guidance as disclosed by management each quarter. Above $400M confirms flat scenario. Below $380M signals early deterioration. Below $360M triggers immediate position review.
The Debt
$100 million revolver due February 2028, $650 million Senior Notes at 3.875% due February 2029, $581 million term loan due February 2030. Total gross debt $1.33 billion against approximately $175 million of cash.
The business generates $410 million of unlevered FCF annually in the base case. Debt service coverage is approximately 6–7x. The Senior Notes at 3.875% maturing 2029 will need to be refinanced at likely 6–7%, potentially higher. The incremental annual interest cost at 6.5% is approximately $17 million. At 9% it is approximately $33 million. Against $410 million of unlevered FCF both are manageable.
In the declining FCF scenario the calculus changes materially. The combination of declining FCF and credit stress at the refinancing window is the scenario that converts a business problem into a permanent capital loss event.
The Tax Receivable Agreement
The $2.73 billion TRA liability is more than twice the entire market cap. When tax rates fall favorably, the liability remeasures downward and a large non-cash gain flows through GAAP net income. GAAP EPS inflates with no cash received and no operational improvement. This happened in 2023 when Other income was $178.8 million - almost entirely a TRA remeasurement gain. GAAP net income that year was $107.3 million. Strip the TRA gain and GAAP net income was deeply negative.
When rates rise adversely, the reverse happens. A large non-cash loss flows through GAAP EPS on an event with zero operational significance.
The TRA also complicates any acquisition scenario. A buyer must negotiate the disposition of $2.73 billion of TRA obligations alongside $1.33 billion of gross debt and the pending securities class action. The effective total consideration for a buyer is substantially higher than the equity price suggests.
The practical rule: Every quarter, before reading GAAP EPS, isolate the TRA remeasurement impact in Other income (loss), net and reconstruct real owner earnings independently from the unlevered FCF disclosure. TRA-driven selloffs are potential add opportunities. TRA-driven rallies are potential trim signals.
The Scenarios
All scenarios use real owner earnings with a December 2029 exit. Unlevered FCF held flat at $410M through 2026–2028 in all scenarios except disaster and left-tail where the declining FCF trajectory is explicitly incorporated. Normalized entry multiple: 3.9x. The Apollo question is embedded in the probability weights, specifically in the 35% bear case probability, which reflects genuine uncertainty about whether the enterprise moat is structural or executional. Until primary research resolves that question, the bear case carries elevated weight.
Disaster: 5% probability
“Declining FCF meets balance sheet stress and litigation compounding”
Revenue declines 10–15% from current levels. Unlevered FCF falls from $410M in 2026 to $350M in 2027 and $300M in 2028, stabilizing around $285M in 2029. The refinancing occurs at punitive terms - 8.5–9% - because lenders are pricing a visibly deteriorating business. Cash interest rises to approximately $72 million annually post-refinancing. A large above-limits litigation settlement consumes $75–100 million of balance sheet cash in the settlement year, compounding the FCF stress. Buybacks cease entirely. No acquisition occurs at a premium within the investment horizon.
Economic owner earnings per share by 2029: ~$0.48 Exit multiple: 3x Exit price: ~$1.44 Total loss from $3.85: −63%… Annualized return: −28%
Left-Tail: 15% probability
“Partial FCF compression, Apollo closes the enterprise gap, litigation persists”
Revenue declines more than expected. Unlevered FCF declines toward $340–360M by 2028. The Apollo question resolves unfavorably - Apollo’s enterprise contributor quality has improved enough that a meaningful portion of ZoomInfo’s $100K+ renewal base evaluates both options and concludes Apollo is sufficient at lower cost. Upmarket NRR falls below 97%. Operations ARR stalls below $220M. The board becomes conservative on buybacks. The litigation remains unresolved through the investment horizon, prolonging the institutional ownership restriction and contributing to multiple compression. The securities class action settles within D&O policy limits but the legal fees, management distraction, and continued institutional avoidance suppress the multiple.
Economic owner earnings per share by 2029: ~$0.59 Exit multiple: 4x Exit price: ~$2.36 Total loss from $3.85: −39%… Annualized return: −15%
Bear: 35% probability
“FCF holds flat, Apollo question unresolved, no re-rating, litigation overhang persists”
Unlevered FCF holds at $410M throughout. The Apollo question remains genuinely unresolved - neither clearly structural nor clearly executional from the available evidence. The transition is real but slow. Operations ARR reaches $250M decelerating to 10–12% growth. NRR stabilizes at 100–101% but never improves enough to confirm the thesis. The consumption model launches but produces revenue recognition variability the market interprets as noise. The securities class action settles within D&O policy limits in 2027 but the settlement announcement comes too late to drive meaningful re-rating. Institutional restrictions lift gradually post-settlement but new institutional buyers are not rushing into a 1–2% revenue growth software business facing an unresolved competitive question. The multiple stays in the 5–7x range throughout.
Economic owner earnings per share by 2029: ~$0.82 Exit multiple: 6x Exit price: ~$4.92 Total gain from $3.85: +28%… Annualized return: +8.5%
This bear case does not clear the 20% hurdle. The thesis requires at least partial business quality confirmation to generate the returns that justify the position.
Base: 30% probability
“Transition confirms, Apollo question resolves favorably, litigation resolves, stable re-rating”
Unlevered FCF holds flat at $410M in 2026–2028 and modestly improves in 2029. The upmarket migration proves out through data. $100K+ ACV cohort resumes sequential growth by Q3 2026. Operations ARR reaches $275–285M growing 14–16%. Revenue re-accelerates to 4–5% annually by 2028–2029. Refinancing occurs cleanly. The Apollo question resolves favorably through enterprise retention data - above-100% upmarket NRR across multiple consecutive quarters confirms that enterprise customers are not finding Apollo’s data sufficient at lower prices. The securities class action settles within D&O policy limits in 2027, removing the institutional ownership restriction and unlocking incremental buying from investors who were sidelined. The market re-rates from distressed to stable platform.
Economic owner earnings per share by 2029: ~$1.17 Exit multiple: 9.5x Exit price: ~$11.12 Total gain from $3.85: +189%… Annualized return: +43%
Bull: 10% probability
“AI infrastructure thesis confirms, Apollo clearly loses the enterprise segment, litigation resolves as catalyst”
Operations ARR crosses $400M growing 18–20%. MCP consumption revenue becomes a disclosed line item. Upmarket NRR reaches 105%+. Revenue grows 7–8% annually. Unlevered FCF improves toward $460–470M by 2029 as consumption revenue flows through at near-zero marginal cost. The Apollo question resolves decisively - retention data, win rate disclosures, and enterprise customer commentary make clear that Apollo is not competitive in the $100K+ segment. The moat is confirmed as structural. The litigation settlement in 2026–2027 acts as a genuine re-rating catalyst, institutional ownership restrictions lift and the multiple begins reflecting the AI infrastructure narrative.
Economic owner earnings per share by 2029: ~$1.41 Exit multiple: 15x Exit price: ~$21.15 Total gain from $3.85: +449%… Annualized return: +76%
Super-Bull: 5% probability
“Platform status, consumption model transforms the business, moat proven beyond doubt”
The consumption model fully replaces seat revenue with faster-growing higher-margin consumption. Operations ARR crosses $440M. MCP and API revenue reaches $75–85M growing 50%+ and is disclosed separately. Upmarket NRR reaches 107–108%. Unlevered FCF improves toward $490–500M. The Apollo question resolves completely, Apollo’s enterprise market share gains stall as ZoomInfo’s consumption model makes the pricing comparison moot. ZoomInfo is no longer competing on price per seat; it is competing on data consumption value per workflow, where its scale and data quality produce a widening rather than narrowing advantage. Strategic acquirer interest surfaces. Business quality has genuinely improved and the multiple reflects infrastructure status.
Economic owner earnings per share by 2029: ~$1.51 Exit multiple: 17x Exit price: ~$25.67 Total gain from $3.85: +567%… Annualized return: +87%
Probability-Weighted Summary:
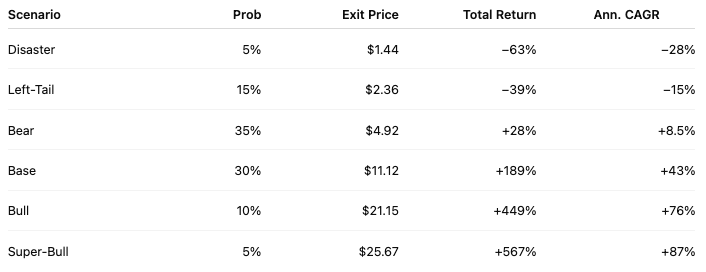
The framing: only 45% of modeled scenarios produce returns above 20% annualized. The bear case, carrying 35% probability, produces only 8.5% annualized. The thesis requires business quality confirmation, at minimum the base case materializing, to generate the returns that justify the position. The Apollo question is the primary reason the bear case carries 35% probability. It is not a peripheral risk. It is the central unresolved question that determines whether this investment becomes something larger than a capital recovery position.
The Entry Strategy - Sizing for Type 1 Error Avoidance
At a 5% position size the disaster scenario produces a −3.2% portfolio impact. At 8% it produces a −5.0% portfolio impact. Both are survivable and recoverable.
At $3.75–3.85: Starter position, 1% of portfolio. Operational requirement: None. The 3.9x normalized valuation justifies initiation.
At $3.25–3.50: Add on Q2 negative revenue print, 2-3% of portfolio. Operational requirement: Operations ARR still growing above 18%. Upmarket NRR holding above 95%. Management still buying aggressively. Full year unlevered FCF guidance unchanged at $400M+. A price decline without operational confirmation is a warning signal, not a buying opportunity.
At $2.75–3.00: Add on Q3 negative print, 3-5% of portfolio. Operational requirement: Same as above. Full year unlevered FCF guidance must remain at or above $380M. Any revision below $380M triggers immediate reassessment rather than addition.
At $2.25–2.75: Add on capitulation, 10% of portfolio. Operational requirement: Operations growing above 15%, upmarket NRR above 95%, management buying aggressively, and full year unlevered FCF guidance holding above $360M. If FCF guidance is deteriorating this tranche does not get deployed.
Total position before primary research: 5% of portfolio maximum.
After primary research resolves the Apollo question: add to 10–12% of portfolio. The most important primary research question for this investment is not about Microsoft, not about the TRA, not about litigation, and not about refinancing. It is this: talk to enterprise buyers who have evaluated both ZoomInfo and Apollo in the last 12 months and ask them what they found. That conversation, more than any public filing or earnings transcript, will tell us whether the moat is structural or executional. Until it happens, size accordingly.
The non-negotiable exit trigger: If $100K+ ACV customer count declines for three consecutive quarters, upmarket NRR falls below 95%, Operations ARR decelerates below 12% growth simultaneously, or full year unlevered FCF guidance is revised below $360 million - the thesis is broken. Exit regardless of price. Do not average down into a deteriorating business.
What the Monitoring Metrics Will Tell You
Six numbers tell you in real time which scenario is materializing. Check these before reading any other metric - especially before reading GAAP EPS, which will be distorted by TRA remeasurements, restructuring charges, and SBC accounting.
Unlevered FCF guidance. The single most important number. Management discloses this explicitly every quarter. Above $400M confirms flat scenario. Below $380M signals early deterioration. Below $360M triggers immediate position review.
Operations ARR growth rate. Sustained above 18% confirms base and bull. Deceleration below 13% confirms bear. Stalling below $220M confirms left-tail.
$100K+ ACV customer cohort count. Must resume sequential growth by Q3 2026. Two consecutive quarters of sequential decline without an identifiable one-time cause is an immediate thesis-review trigger.
Upmarket net revenue retention. Must hold above 100% through the restructuring disruption. Below 97% is a yellow flag. Below 95% is a thesis-breaking event - and the most direct signal that the Apollo question is resolving unfavorably.
Remaining performance obligations. Declined from $1.252B to $1.183B in Q1 2026. Must stabilize in Q2 and return to growth in Q3.
Litigation status. Watch for discovery developments and settlement announcements. A within-limits settlement is a positive catalyst. An above-limits settlement requiring meaningful balance sheet cash warrants position reassessment.
What This Investment Is and Is Not
ZoomInfo may possess a genuine narrow economic moat: real, structural, but not impregnable and not yet fully proven. It is not the wide economic moat of Visa, Moody’s, or FICO. The moat I have described is the kind of moat that can narrow without disappearing. Pricing power can compress before customer retention visibly deteriorates.
The Apollo question is the largest unresolved variable in the thesis. Not Microsoft. Not litigation. Not the TRA. Not refinancing. Apollo. Because Apollo determines whether the moat is real or whether it is simply better execution. That question cannot be answered from public data alone. It is why the position is capped at 5% before primary research. It is why the bear case carries 35% probability. It is why the thesis requires at least base case confirmation - not just a cheap entry multiple - to generate the returns that justify owning this.
This is a statistically attractive, well-protected undervaluation with a possible business-quality upgrade. The return in the base case comes from both the entry price being irrational relative to cash generation and the business beginning to confirm its quality. It is not a free lunch at 3.9x normalized FCF. It is a position that requires the business to prove something.
The Bottom Line
ZoomInfo may possess one of the most comprehensive commercial B2B datasets currently available, built over 20 years through a mechanism that competitors appear unable to replicate in the enterprise segment within the investment horizon. The business made a series of capital allocation mistakes at the worst possible time and is now executing a painful but rational transition to a consumption-based model that better reflects what the AI era demands.
The security has fallen from $77 to $3.85. The market appears to have concluded the business is broken. The reality: the business generates $410 million of unlevered FCF annually on a $1.13 billion market cap, has $1.14 billion of buyback authorization, has a founder-CEO whose compensation requires the stock to go above $40 before he sees a dollar from it, and has been chosen by Salesforce, HubSpot, Microsoft Copilot, Claude, and ChatGPT as a preferred data integration partner.
Against this stands a securities class action that survived a motion to dismiss, three privacy litigation proceedings, $1.33 billion of gross debt approaching its refinancing window, a $2.73 billion TRA liability complicating any strategic transaction, and most importantly - an Apollo question that determines whether the enterprise moat is structural or merely executional and that cannot be resolved from any public filing.
The thesis does not require ZoomInfo to become a wonderful business. It requires that the FCF holds at approximately current levels and that the business not be as broken as the price implies. At 3.9x normalized real owner earnings, the market is pricing far worse outcomes than the evidence suggests are likely.
Two quarters of ugly revenue numbers are coming. The market will read them badly. That is the entry opportunity - provided the six monitoring metrics are confirming rather than deteriorating and the unlevered FCF guidance remains intact.
The single most important question between now and a full-sized position is not in any quarterly filing. It is a conversation with enterprise buyers who have evaluated both ZoomInfo and Apollo in the last 12 months. That conversation will tell you more about the durability of this investment than everything else combined.
Disclaimer:
This is not investment advice. Do your own work. I am a concentrated value investor managing my own capital. The analytical framework here reflects my own process and conclusions, which may be wrong in ways I have not anticipated. I hold a position in the securities discussed and will add to it as described above.
 | A guest post by
|