
Stride (LRN): Anticipated Future Returns
What Should I Expect From Here?

When I first wrote about Stride Inc., the stock was trading in the low-$60s. The free-cash-flow yield was approaching ~14%, the price dislocation was severe, and the market appeared to be pricing permanent impairment into what I believed was a temporary execution failure.
At that point, I didn’t spend much time modeling forward returns. Frankly, I didn’t think it mattered - the valuation itself provided substantial margin of safety regardless of near-term multiple compression, and the situation fit what Buffett would call a work-out (a situation-dependent investment where value realization depends on a specific, identifiable issue resolving rather than on long-term growth).
Today, at ~$87, the question is different.
This is no longer about identifying a dislocation. It’s about whether capital should remain here, be increased, or be redeployed - and that requires being explicit about anticipated future returns from today’s price. Running my framework at current prices produces a probability-weighted expected return of roughly ~11–12% annually over the next three years - attractive, but meaningfully below the returns implied when the stock was trading in the low $60’s. The purpose of this update is to show why.
As you know from my last several write-ups, I now tend to think about investments in four discrete states of the world, each with explicit probabilities attached. This post updates my original Stride thesis for readers who haven’t seen it - and for those who have, but want to understand what the opportunity looks like from here.
What Actually Happened at Stride (Quick Recap)
Stride did not lose demand.
It did not lose profitability.
And it did not lose liquidity.
What it lost - severely and suddenly - was market trust.
A poorly executed technology rollout during the last enrollment season created real friction for families attempting to enroll. That friction led to elevated withdrawals and missed enrollments. Based on management commentary and the change in enrollment trajectory before and after the rollout, I estimate that approximately 10,000 incremental students were lost to friction-related attrition. At roughly ~$10,000 of annual revenue per student, that implies about $100M of revenue and roughly $40M of free cash flow at observed incremental margins.
Importantly:
Enrollment still grew year-over-year (7.8% through Q2 FY26, despite elevated withdrawals)
Profitability remained intact
Liquidity stayed strong
The stock, however, collapsed from ~$155 to ~$55 almost overnight.
That episode matters. It demonstrates that price outcomes here are driven far more by confidence than by economics, and that when confidence breaks, the market is willing to reprice Stride to 6–7× free cash flow even if the business itself continues to function.
Why This Update Is Warranted Now
This update is not about price movement alone. It’s about new information.
Since the original post:
Q2 FY26 results showed platform stabilization
Enrollment growth resumed despite the prior disruption
Management reaffirmed FY26 guidance
The stock re-rated from low $60’s to ~$87
The unlevered free-cash-flow yield compressed from ~14% to ~9.3%
That compression - not the absolute price - is the analytical question today.
Career Learning: The Engine That Still Matters
Career Learning (CL) remains the most important long-term driver of Stride’s economics. These are career-oriented pathways (healthcare, IT, skilled trades, and other workforce-aligned programs) layered on top of core education.
A few facts that matter:
Career Learning carries higher revenue per student and higher incremental margins than General Education (GE).
Many districts start with GE and later add CL.
As of the most recent filings, approximately 31 schools remain GE-only, creating embedded expansion potential without winning new districts.
This creates a within-district compounding mechanism - growth through deeper penetration, not just new logos.
My base case assumes Career Learning maintains its current trajectory. It does not assume that growth alone earns a premium multiple in a politically exposed business.
Starting Point (Today)
Share price: ~$87
Economic shares outstanding: ~44.0M
Market cap: ~$3.83B
Net cash: ~$85M
Enterprise value: ~$3.74B
Normalized owner unlevered FCF: ~$320–350M
The LTM operating cash flow of $247.5M includes an approximately $300M accounts receivable build driven by enrollment billing seasonality. Normalizing for the expected H2 collection of this receivable, and deducting the $40.9M of stock-based compensation that, while non-cash, represents real dilution to equity holders and should be treated as an economic cost in arriving at true owner free cash flow, produces a normalized owner unlevered free cash flow of approximately $320–350M.
Current valuation:
EV / FCF ≈ 10.8×
Unlevered FCF yield ≈ ~9.3%
This is no longer distressed pricing - but it still embeds skepticism.
The Four States of the World
Probability Weights
Left Tail: 30%
Bear: 25%
Base: 30%
Bull: 15%
These probabilities reflect confidence in the underlying economics, respect for political and perception risk, and realism about valuation ceilings in education.
1) Left Tail - Confidence Breaks Again (30%)
This is not a slow deterioration. It is another step-function loss of trust.
What causes the left tail?
Execution stumbles resurface or enrollment optics disappoint
Political pressure around school choice intensifies
Funding uncertainty grows, including:
the shift of Perkins V oversight toward the Department of Labor - the federal Career and Technical Education funding program that supports Career Learning - introducing additional administrative and compliance uncertainty into a revenue stream that currently faces relatively light oversight
state-level budget gaps and payment timing delays
The market revisits a conclusion it has already demonstrated once… “We don’t trust this.”
Path (FY26–FY28)
FY26: stabilization narrative fails; growth slows materially
FY27: buybacks throttled ahead of convert maturity
FY28: business functional but trust impaired
Economics (FY28)
FCF: ~$235M
Shares: ~42.0M
FCF/share: ~$5.60
Exit multiple: ~6.5×
Value: ~$36/share*
*during panic, price could overshoot to $25–30
IRR (3 years): ~-26%
2) Bear - Meh, but Functional (25%)
Stabilization works, but growth is slower than hoped. No new trust violation - just underwhelming execution.
Path (FY26–FY28)
FY26: stabilize
FY27: growth resumes slowly
FY28: targets partially missed
Economics (FY28)
FCF: ~$390M
Shares: ~40.5M
FCF/share: ~$9.63
Exit multiple: ~11×
Value: ~$106/share
IRR (3 years): ~+7%
3) Base - Stabilize, Then Execute (30%)
Management does what it says. Career Learning expands. Buybacks quietly compound per-share value.
Path (FY26–FY28)
FY26: stabilization year
FY27: execution improves
FY28: targets broadly met
Economics (FY28)
FCF: ~$480M
Shares: ~38.5M
FCF/share: ~$12.47
Exit multiple: ~12×
Value: ~$150/share
IRR (3 years): ~+20%
4) Bull - Career Learning Compounds (15%)
Career Learning scales faster than expected, execution stabilizes, and the market begins to treat Stride as a durable platform rather than a fragile operator.
Path (FY26–FY28)
FY26: stabilization exceeds expectations
FY27: mix shift accelerates
FY28: business earns credibility
Economics (FY28)
FCF: ~$580M
Shares: ~37.5M
FCF/share: ~$15.47
Exit multiple: ~14×
Value: ~$216/share
IRR (3 years): ~+35%
Probability-Weighted Outcome
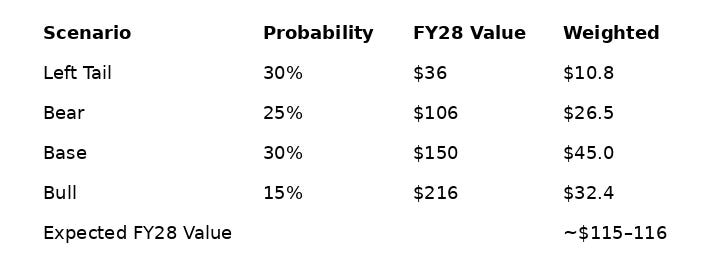
From ~$87 today, this implies ~11–12% probability-weighted annual returns over the next ~3 years.
How I’ll Know Which Scenario I’m In
The scenario path should become materially clearer with Q3 FY26 results, expected in April 2026.
Enrollment growth above ~8% would be consistent with the base case.
Growth below ~5% would begin to suggest movement toward the left tail.
The single most important metric I’m watching is Career Learning enrollment growth. If that segment decelerates materially from its current ~18% trajectory, the thesis requires reassessment regardless of General Education performance.
This is not a set-and-forget investment. It requires monitoring.
How I Think About Intrinsic Value From Here
Three years from now, I don’t need Stride to be admired - I need it to be boring again.
If execution stabilizes, Career Learning continues to penetrate existing districts, and capital is returned rationally, free cash flow per share should be meaningfully higher than it is today. In that world, intrinsic value rises not because enthusiasm returns, but because the arithmetic improves: steady cash generation, modest growth, and fewer shares outstanding.
When I probability-weight the outcomes above, the math points to low double-digit to low-teens annual returns from today’s price. That conclusion is consistent with - not in conflict with - the ~11–12% probability-weighted IRR implied by the scenario table. The difference between expected and realized returns will be dictated by path, not endpoint.
Final Thought
Stride is no longer a no-brainer.
It is a clearly defined work-out with asymmetric outcomes.
The economics are good.
The perception risk is real.
And from here, position sizing matters more than valuation.
That’s the deal on the table today.
Disclaimer
This memo reflects my personal investment framework and opinions. It is not investment advice. I may be wrong, and circumstances can change. I reserve the right to change my mind as new facts emerge.
 | A guest post by
|
Thanks for the followup coverage on Stride. I agree it's no longer a no-brainer price like it was in the $60s, but not bad risk-reward assuming execution and regulatory risks are managed. What do you think about companies adjacent to Stride like Adtalem (ATGE)? They train about 10% of new nurses. Recently their NCLEX exam pass rate dipped below required 80% so market sold them off due to fears but management said they are working to fix that. It's an execution risk, but I think the moat of training nurses might be stronger than K-12 learning and career services offered by Stride, given a projected nursing shortage in America.